Manim utilities
In this chapter we will learn some methods and classes that are quite useful to make our animations, here we will conclude all the class animations.
Helpful methods
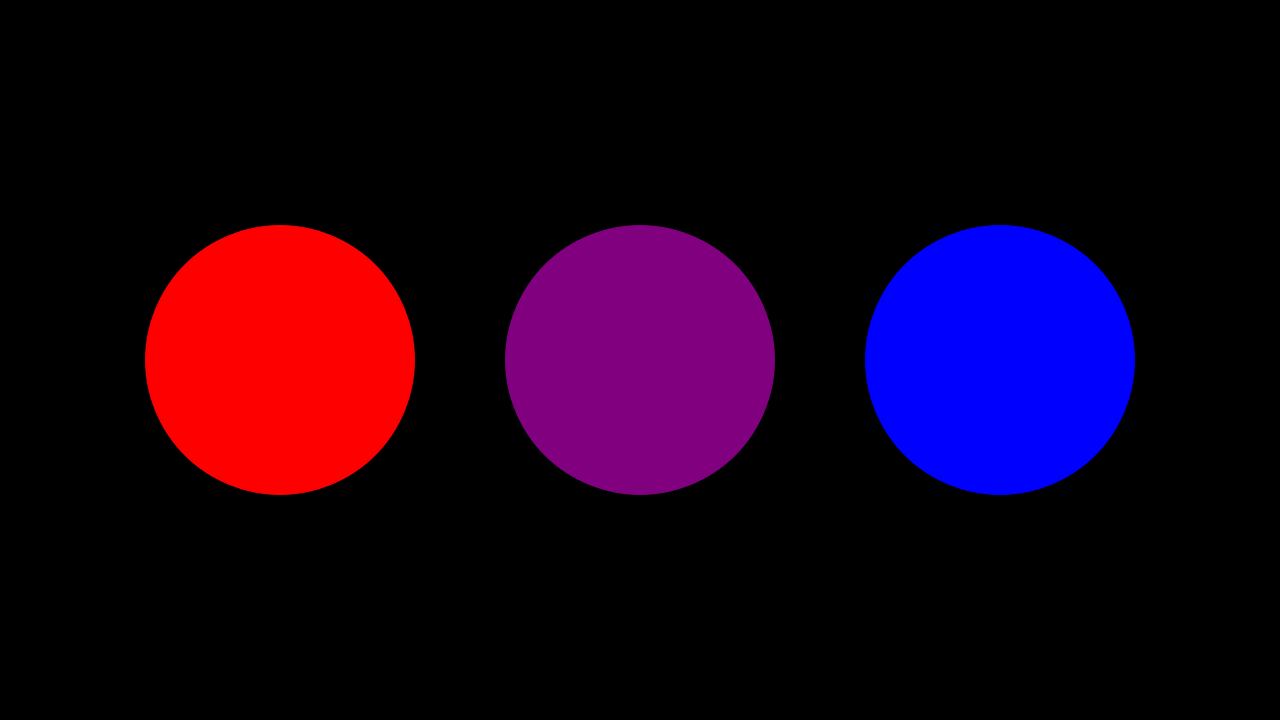
.interpolate_color
As its name implies, it gives you an interpolation between two colors, you can see the official documentation to see its definition and the algorithm, You can see in the same documentation other functions related to color in case you want to learn more.
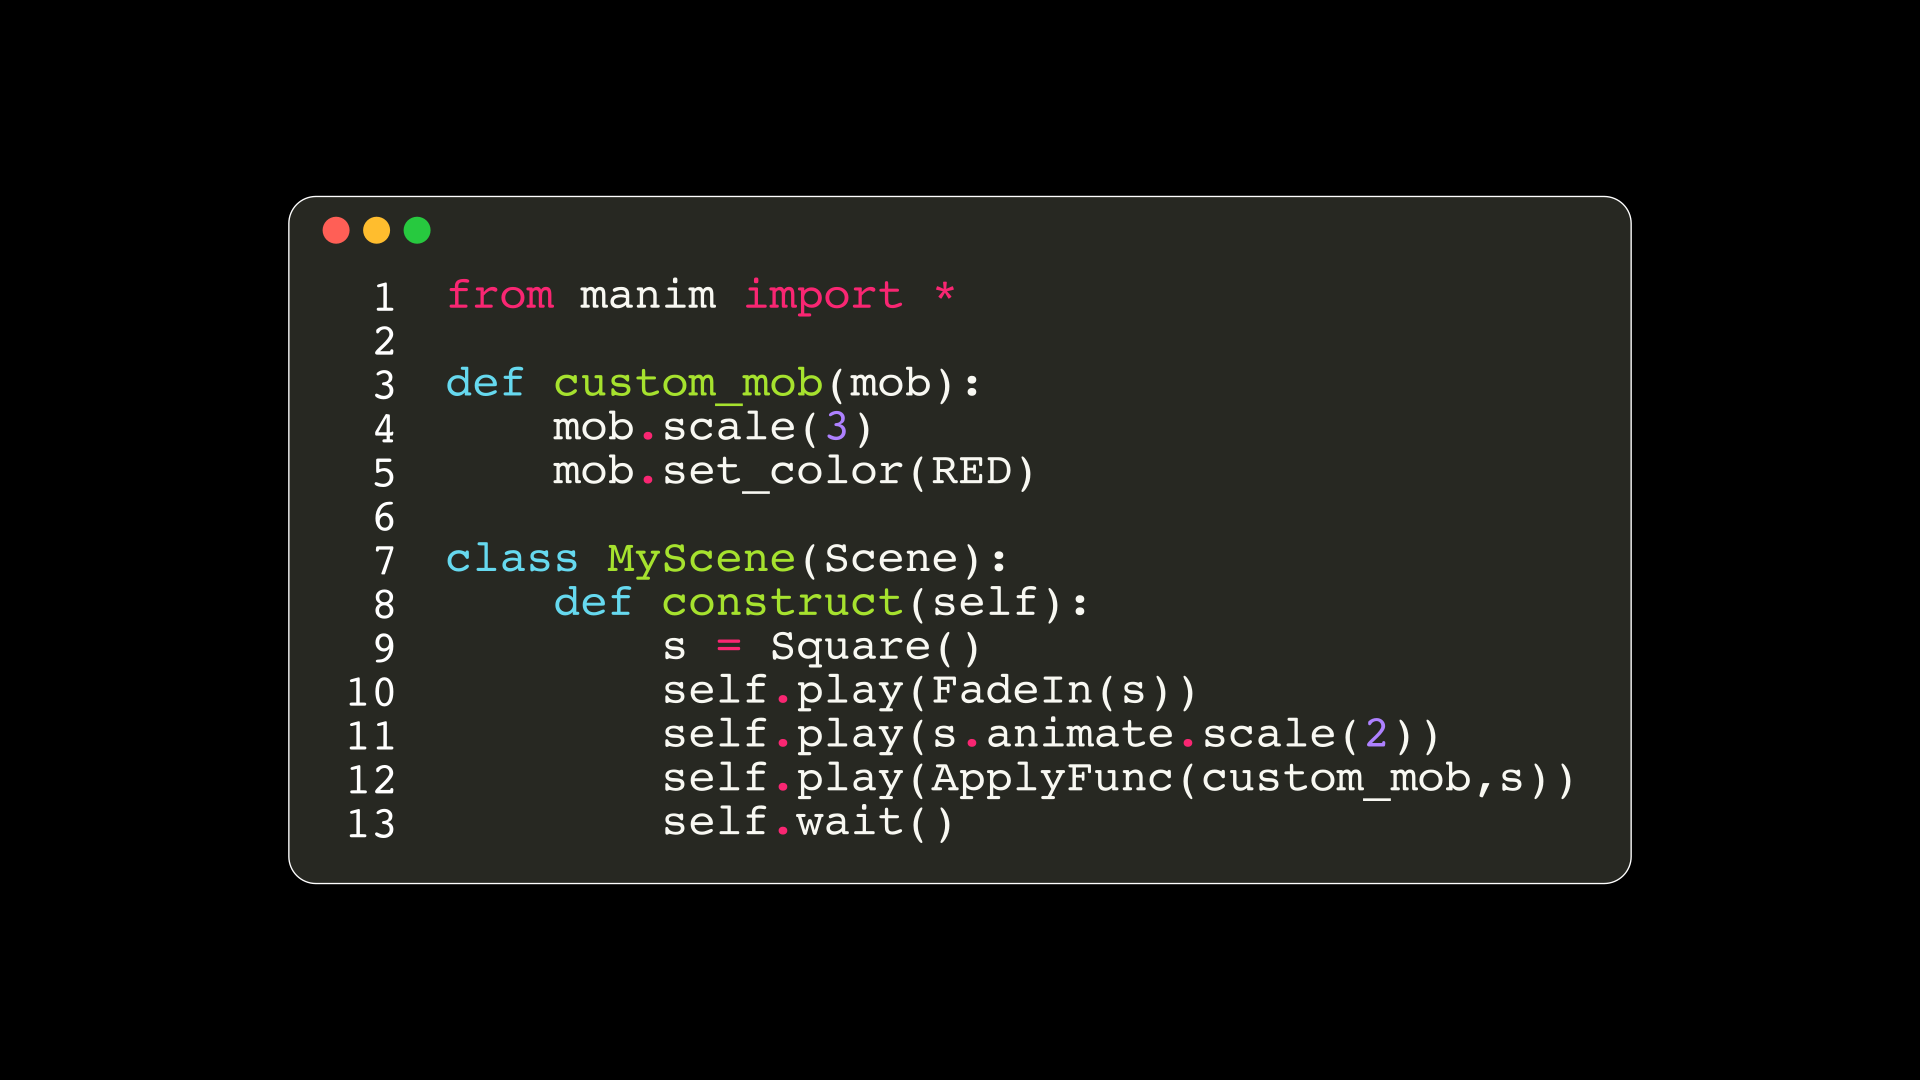
def construct(self):
    dots = VGroup(*[Dot() for _ in range(3)])\
        .set(width=3).arrange(RIGHT,buff=1)

    left_dot, center_dot, right_dot = dots

    color1 = "#FF0000"; color2 = "#0000FF"
    color3 = interpolate_color(color1,color2,0.5)
    #                                         |
    #                                         v
    #                                  0 <= alpha <= 1
    #                               color1         color2

    print([color1,color2,color3])
    # ['#FF0000' '#0000FF' <Color #7f007f>]

    left_dot.set_color(color1)
    right_dot.set_color(color2)
    center_dot.set_color(color3)

    self.add(dots)
Show result
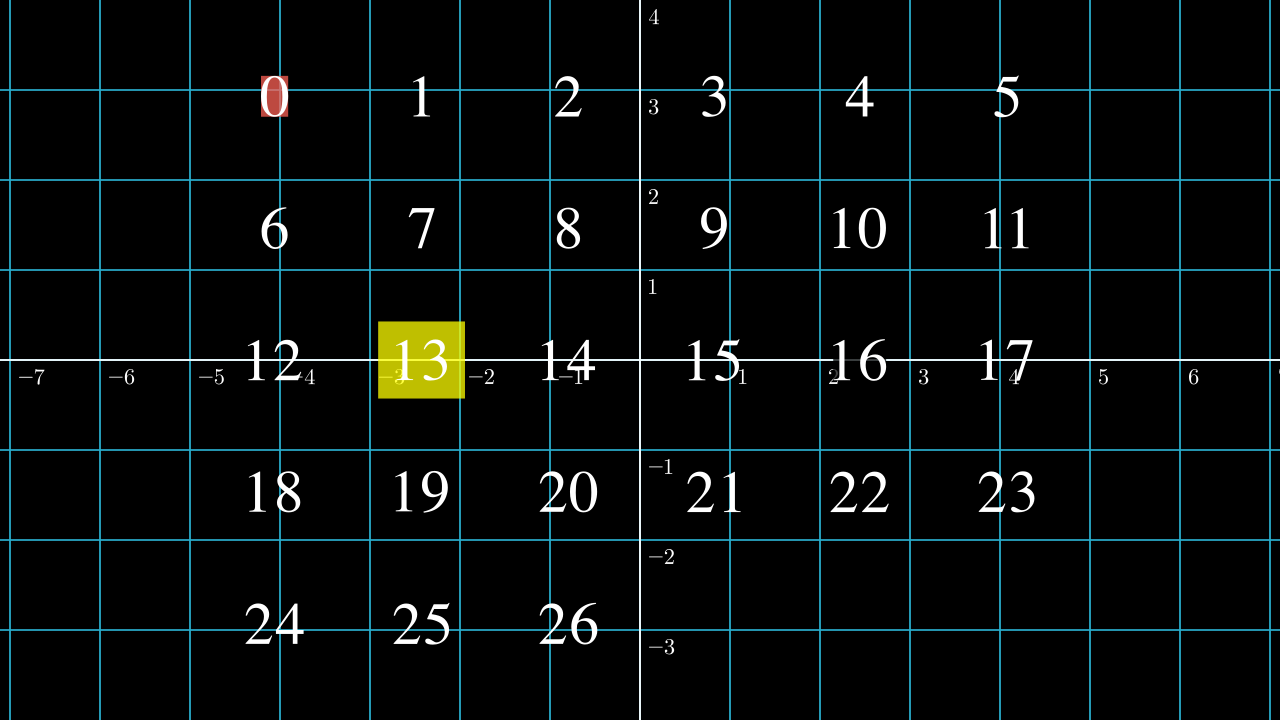
.set_points
Note
For this section we are going to use the grid that you created in previous chapters, and it will help us to understand this method.
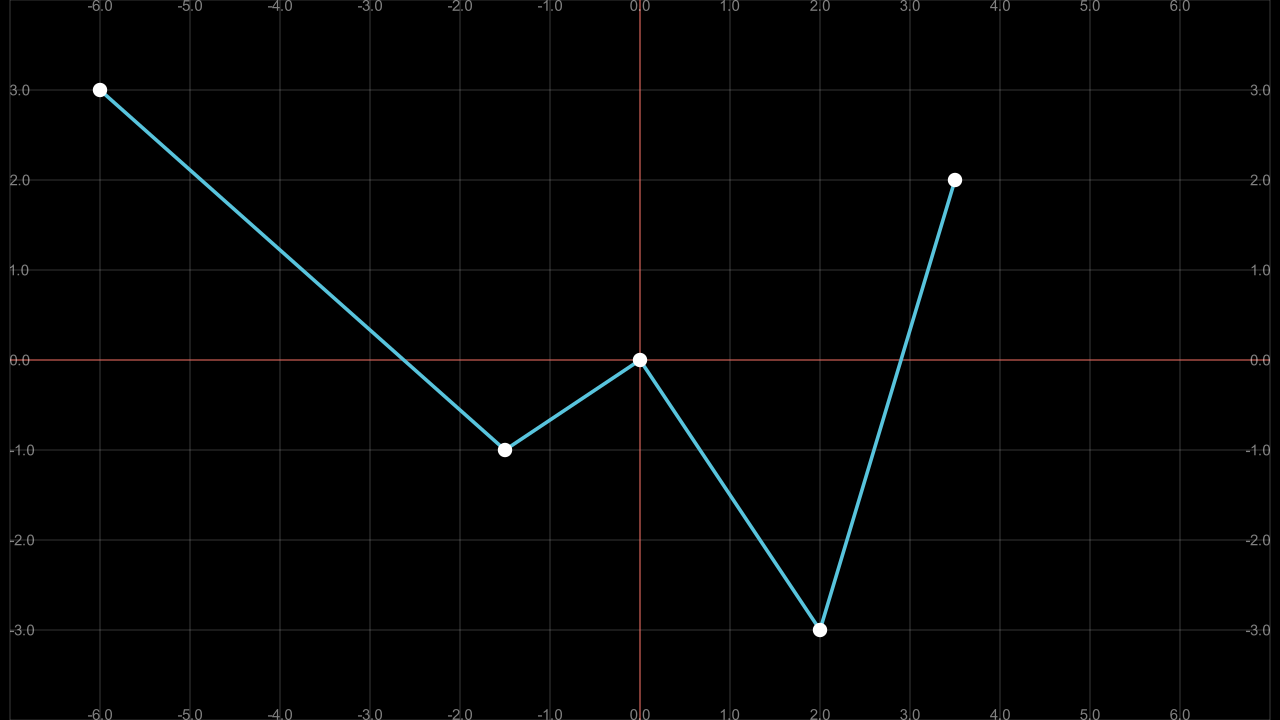
_as_corners
The way to make a polyline using the coordinates of the screen we can do the following:
def construct(self):
    sg = ScreenGrid() # Here is your Grid
    sg.fade(0.5)

    def coord(x,y):
        return np.array([x,y,0])

    points = [
        coord(x,y)
        for x,y in [
            (-6,3),
            (-1.5,-1),
            (0,0),
            (2,-3),
            (3.5,2)
        ]
    ]

    dots = VGroup(*[Dot(p) for p in points])
    polyline = VMobject(color=BLUE).set_points_as_corners(points)

    self.add(sg,polyline,dots)
Show result
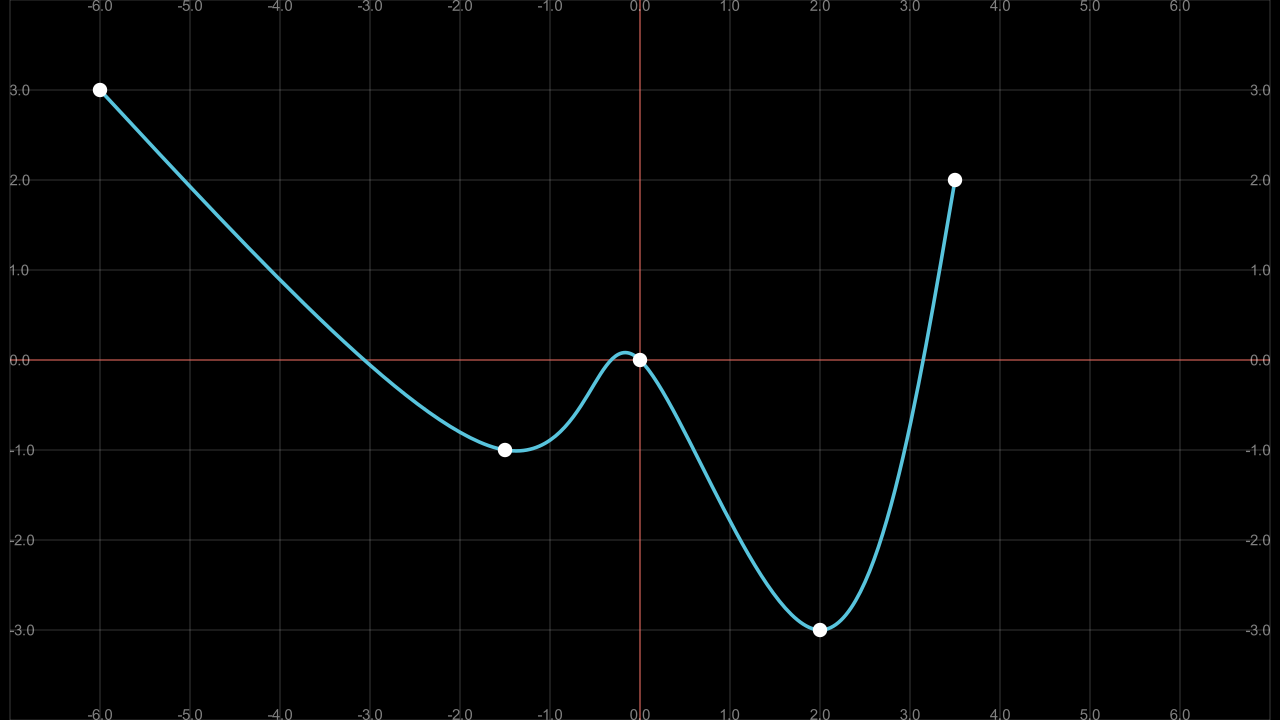
_smoothly
def construct(self):
    sg = ScreenGrid() # Here is your Grid
    sg.fade(0.5)

    def coord(x,y):
        return np.array([x,y,0])

    points = [
        coord(x,y)
        for x,y in [
            (-6,3),
            (-1.5,-1),
            (0,0),
            (2,-3),
            (3.5,2)
        ]
    ]

    dots = VGroup(*[Dot(p) for p in points])
    polyline = VMobject(color=BLUE).set_points_smoothly(points)

    self.add(sg,polyline,dots)
Show result
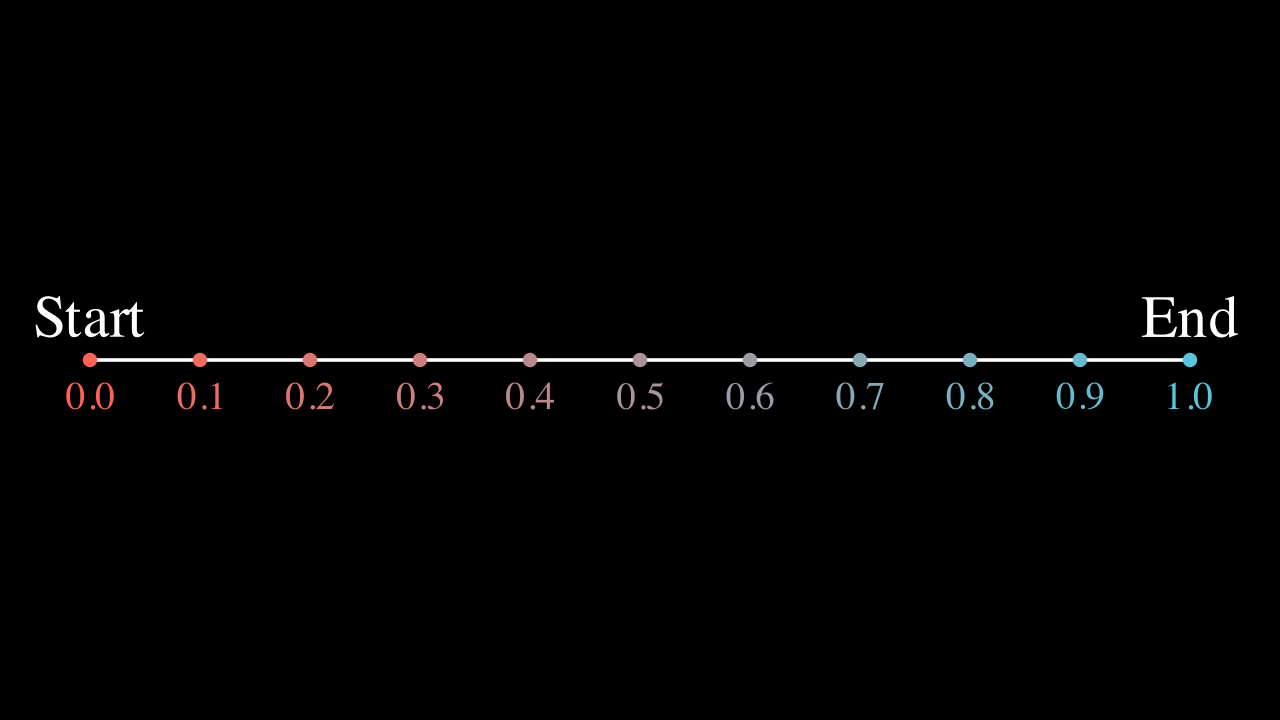
.point_from_proportion
This is an exclusive method for VMobjects, especially for paths (lines and curves).
Think VMobject (a curve) as a road, as you travel the road you can tell the percentage you have completed. Using this analogy with curves (paths) you can locate a point in a percentage of the path using point_from_proportion.
def construct(self):
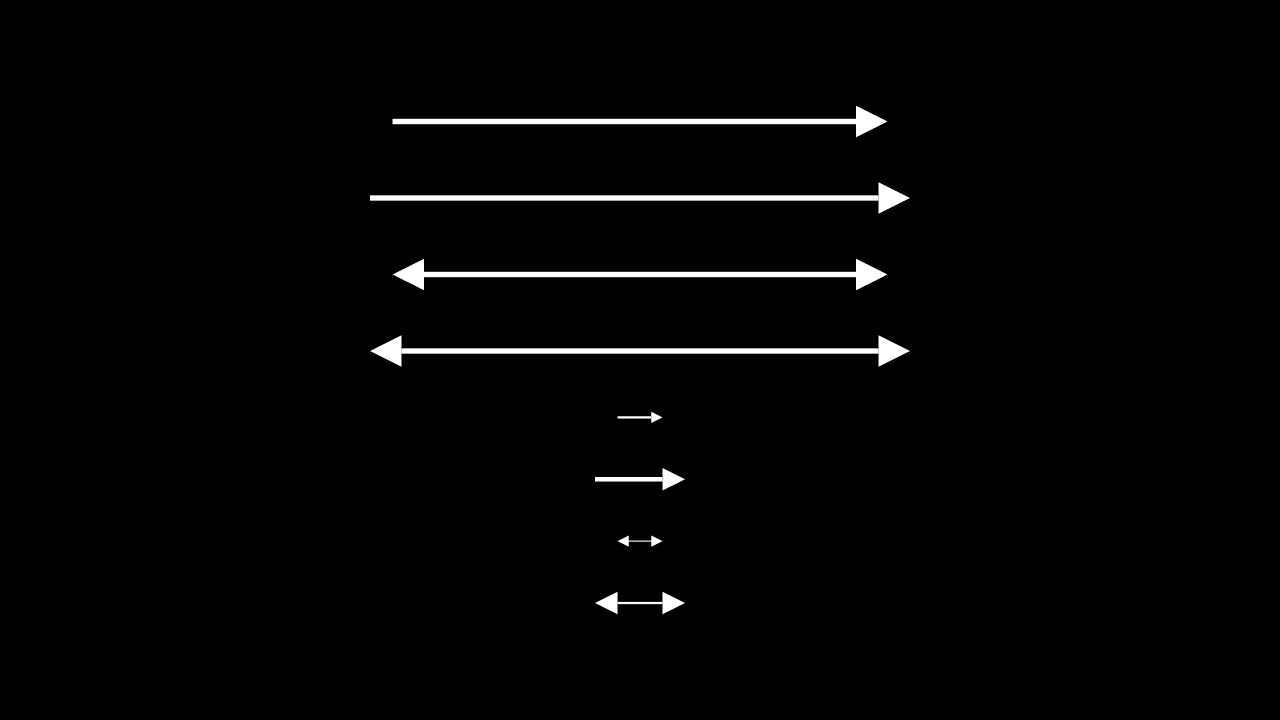
path = Line(LEFT,RIGHT) # We will study this below.
path.width = config.frame_width - 2
proportions = np.arange(0,1.1,0.1)
# 0.1, 0.2, 0.3 ... 1.0
prop_text = VGroup(*[
VGroup(
# The first argument to dot is the
# coordinate where it is located,
# so we don't need to use ".move_to"
# in this case.
Dot(path.point_from_proportion(p)),
Text("%.1f"%p,height=0.3).next_to(path.point_from_proportion(p),DOWN),
).set_color(interpolate_color(RED,BLUE,p))
for p in proportions
])
start = Text("Start").next_to(path.get_start(),UP)
end = Text("End").next_to(path.get_end(),UP)
self.add(path,prop_text,start,end)
Show result
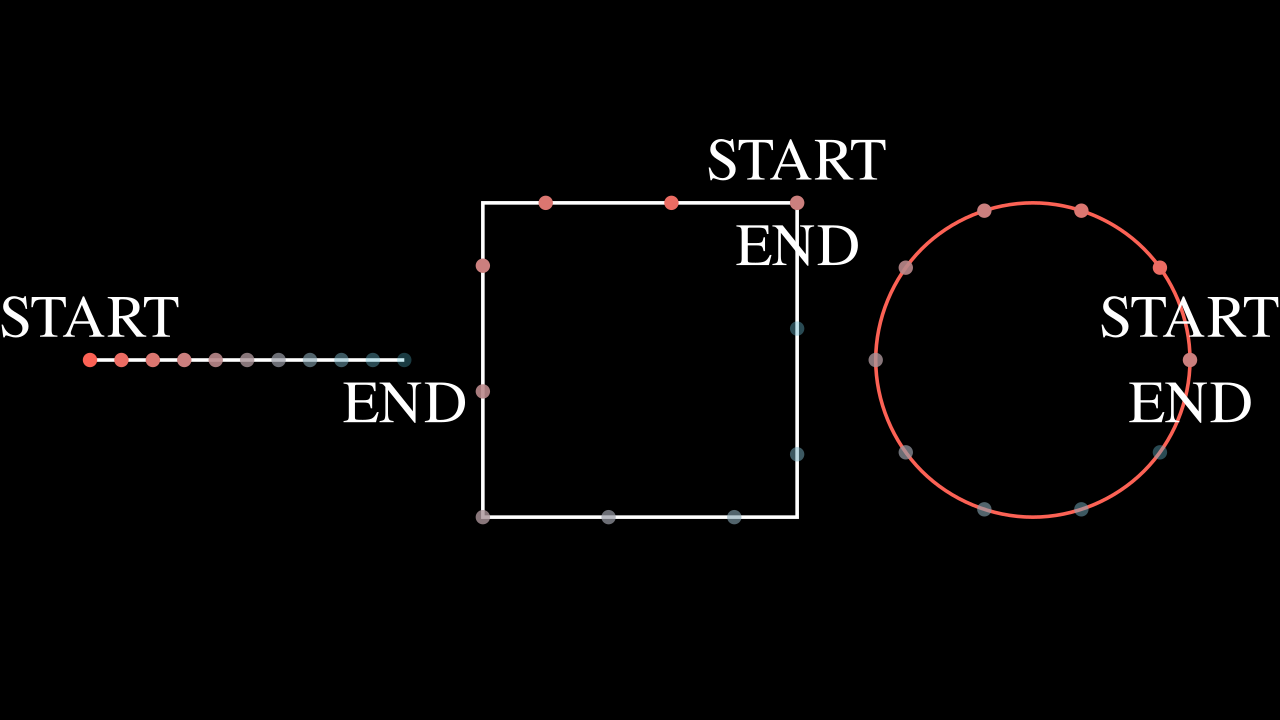
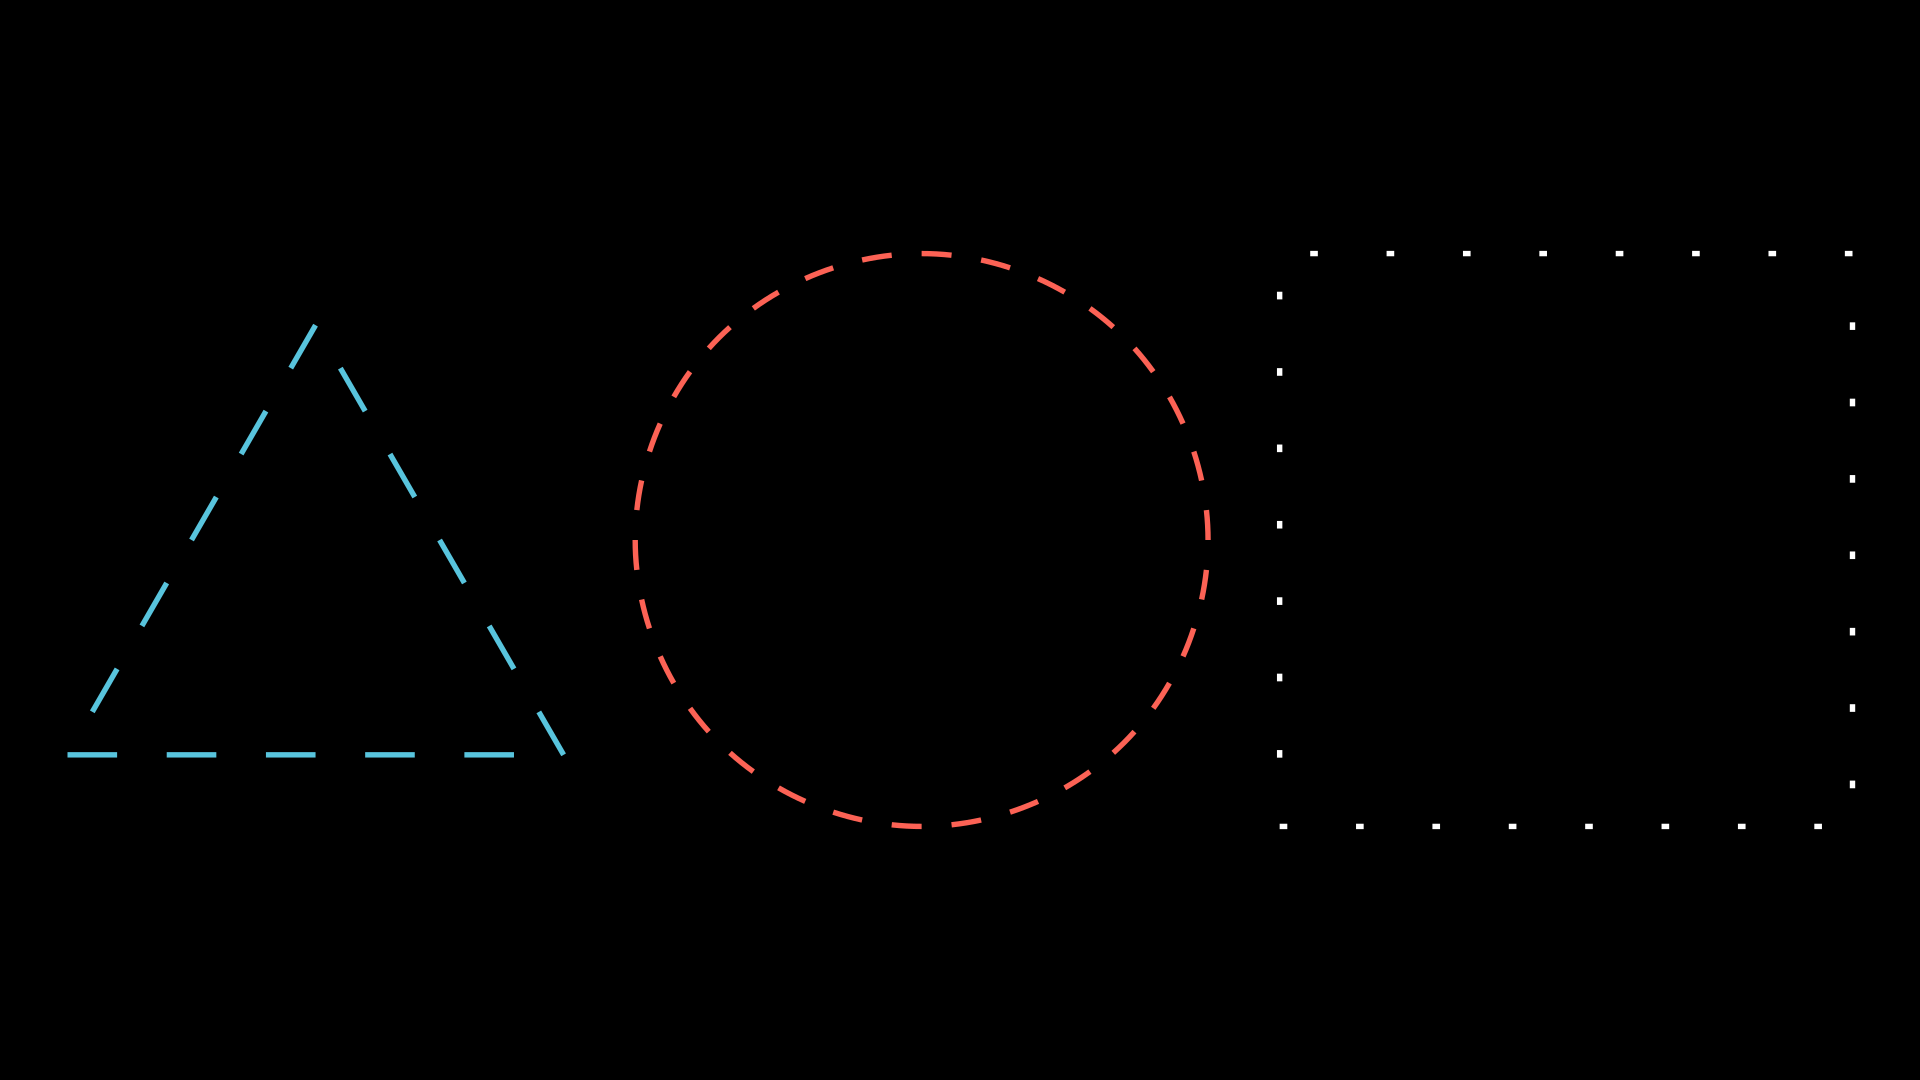
With regular figures it is easy to see what this method means.
def construct(self):
    paths = VGroup(
        Line(LEFT,RIGHT), # We will study this below.
        Square(),
        Circle()
    ).arrange(RIGHT,buff=0.5)\
        .set(width=config.frame_width-2)

    def get_proportions(path,proportions=np.arange(0,1.1,0.1)):
        return VGroup(*[
            Dot(
                # The first argument to dot is the
                # coordinate where it is located,
                # so we don't need to use ".move_to"
                # in this case.
                path.point_from_proportion(p),
                fill_opacity=1-p+0.3,
                color=interpolate_color(RED,BLUE,p)
            )
            for p in proportions
        ])

    def get_start_and_end(path):
        return VGroup(
            Text("START").next_to(path.get_start(),UP),
            Text("END").next_to(path.get_end(),DOWN),
        )

    vgrp_proportions = VGroup(*[
        get_proportions(path)
        for path in paths
    ])
    vgrp_start_end = VGroup(*[
        get_start_and_end(path)
        for path in paths
    ])

    self.add(paths,vgrp_proportions,vgrp_start_end)
Show result
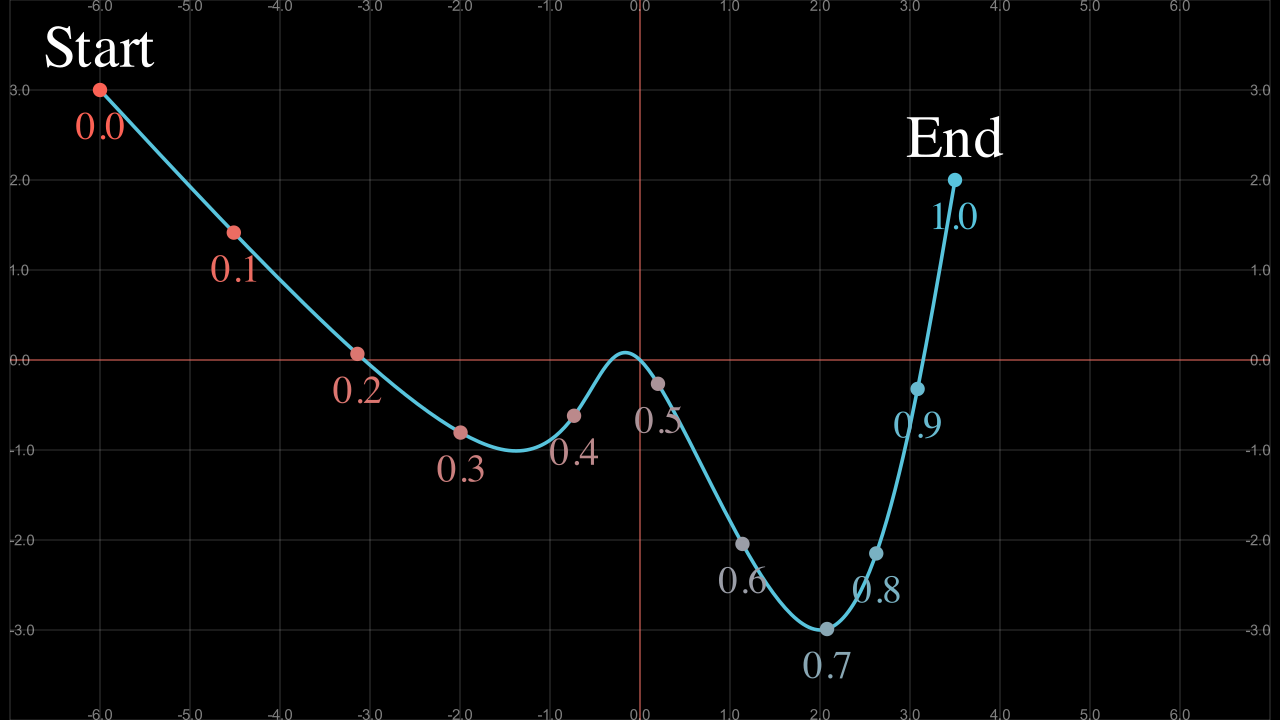
This counts for any VMobject.
def construct(self):
    sg = ScreenGrid() # Here is your Grid
    sg.fade(0.5)

    proportions = np.arange(0,1.1,0.1)
                # 0.1, 0.2, 0.3 ... 1.0

    def coord(x,y):
        return np.array([x,y,0])

    points = [
        coord(x,y)
        for x,y in [
            (-6,3),
            (-1.5,-1),
            (0,0),
            (2,-3),
            (3.5,2)
        ]
    ]

    polyline = VMobject(color=BLUE).set_points_smoothly(points)

    prop_text = VGroup(*[
        VGroup(
            # The first argument to dot is the
            # coordinate where it is located,
            # so we don't need to use ".move_to"
            # in this case.
            Dot(polyline.point_from_proportion(p)),
            Text("%.1f"%p,height=0.3)
                .next_to(polyline.point_from_proportion(p),DOWN),
        ).set_color(interpolate_color(RED,BLUE,p))
        for p in proportions
    ])

    start = Text("Start").next_to(polyline.get_start(),UP)
    end   = Text("End").next_to(polyline.get_end(),UP)
Show result
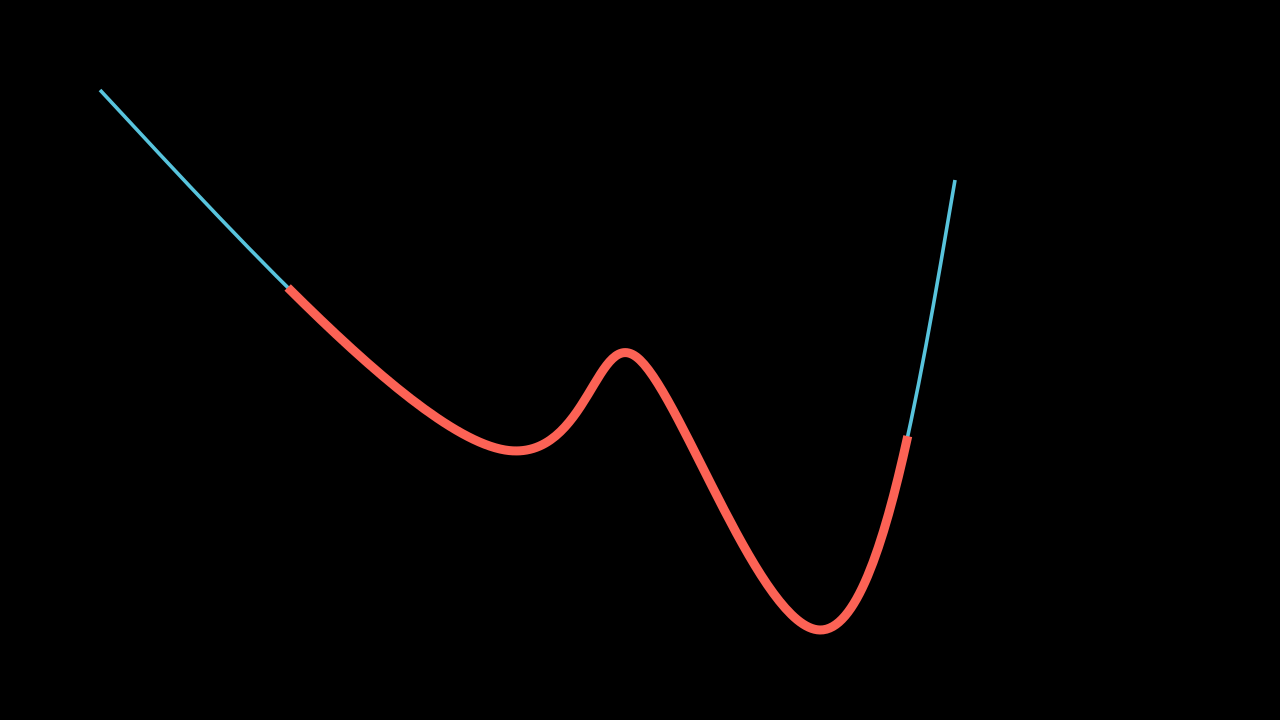
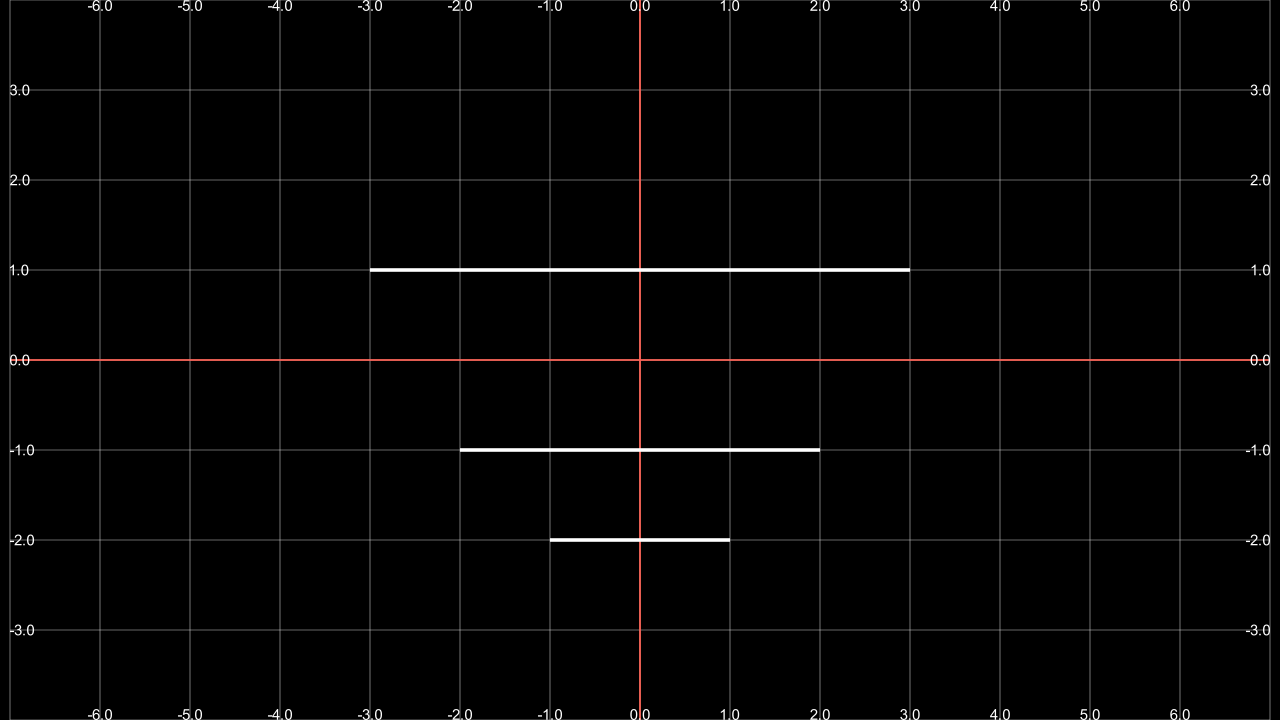
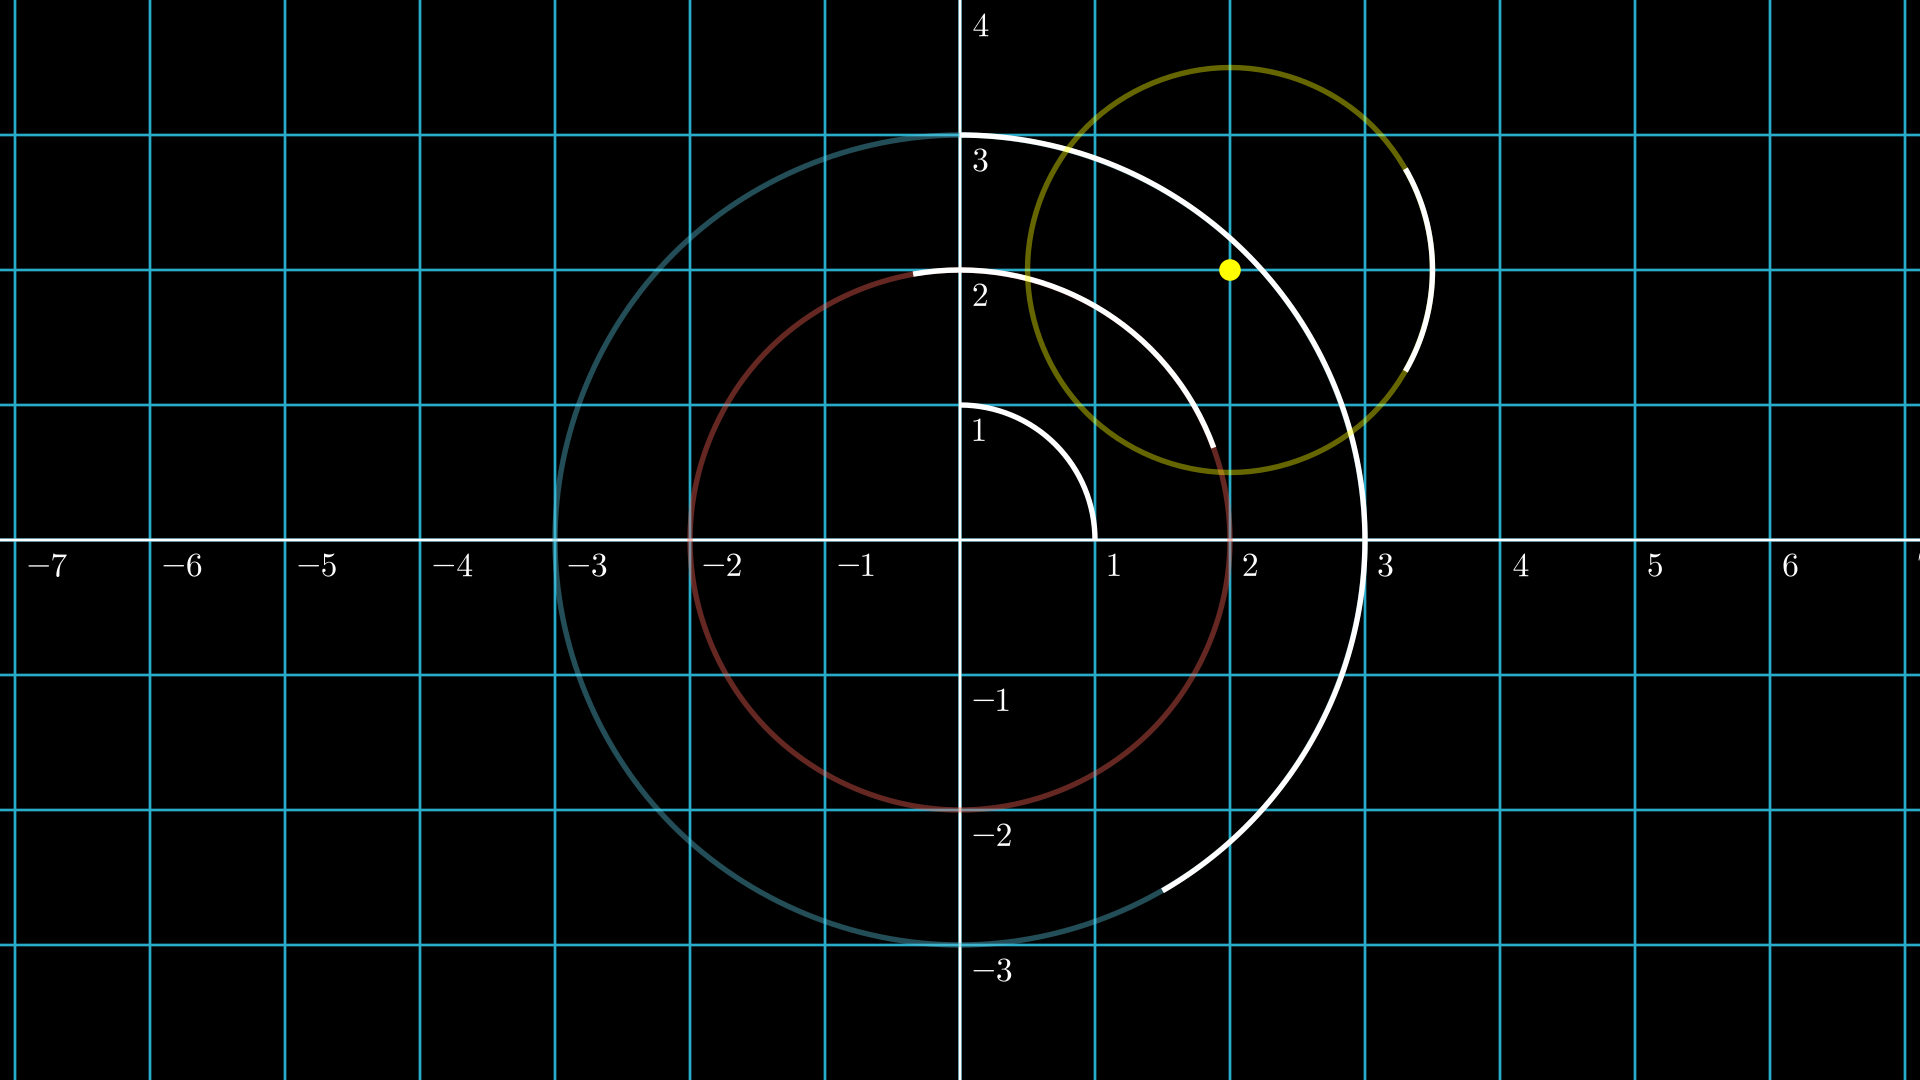
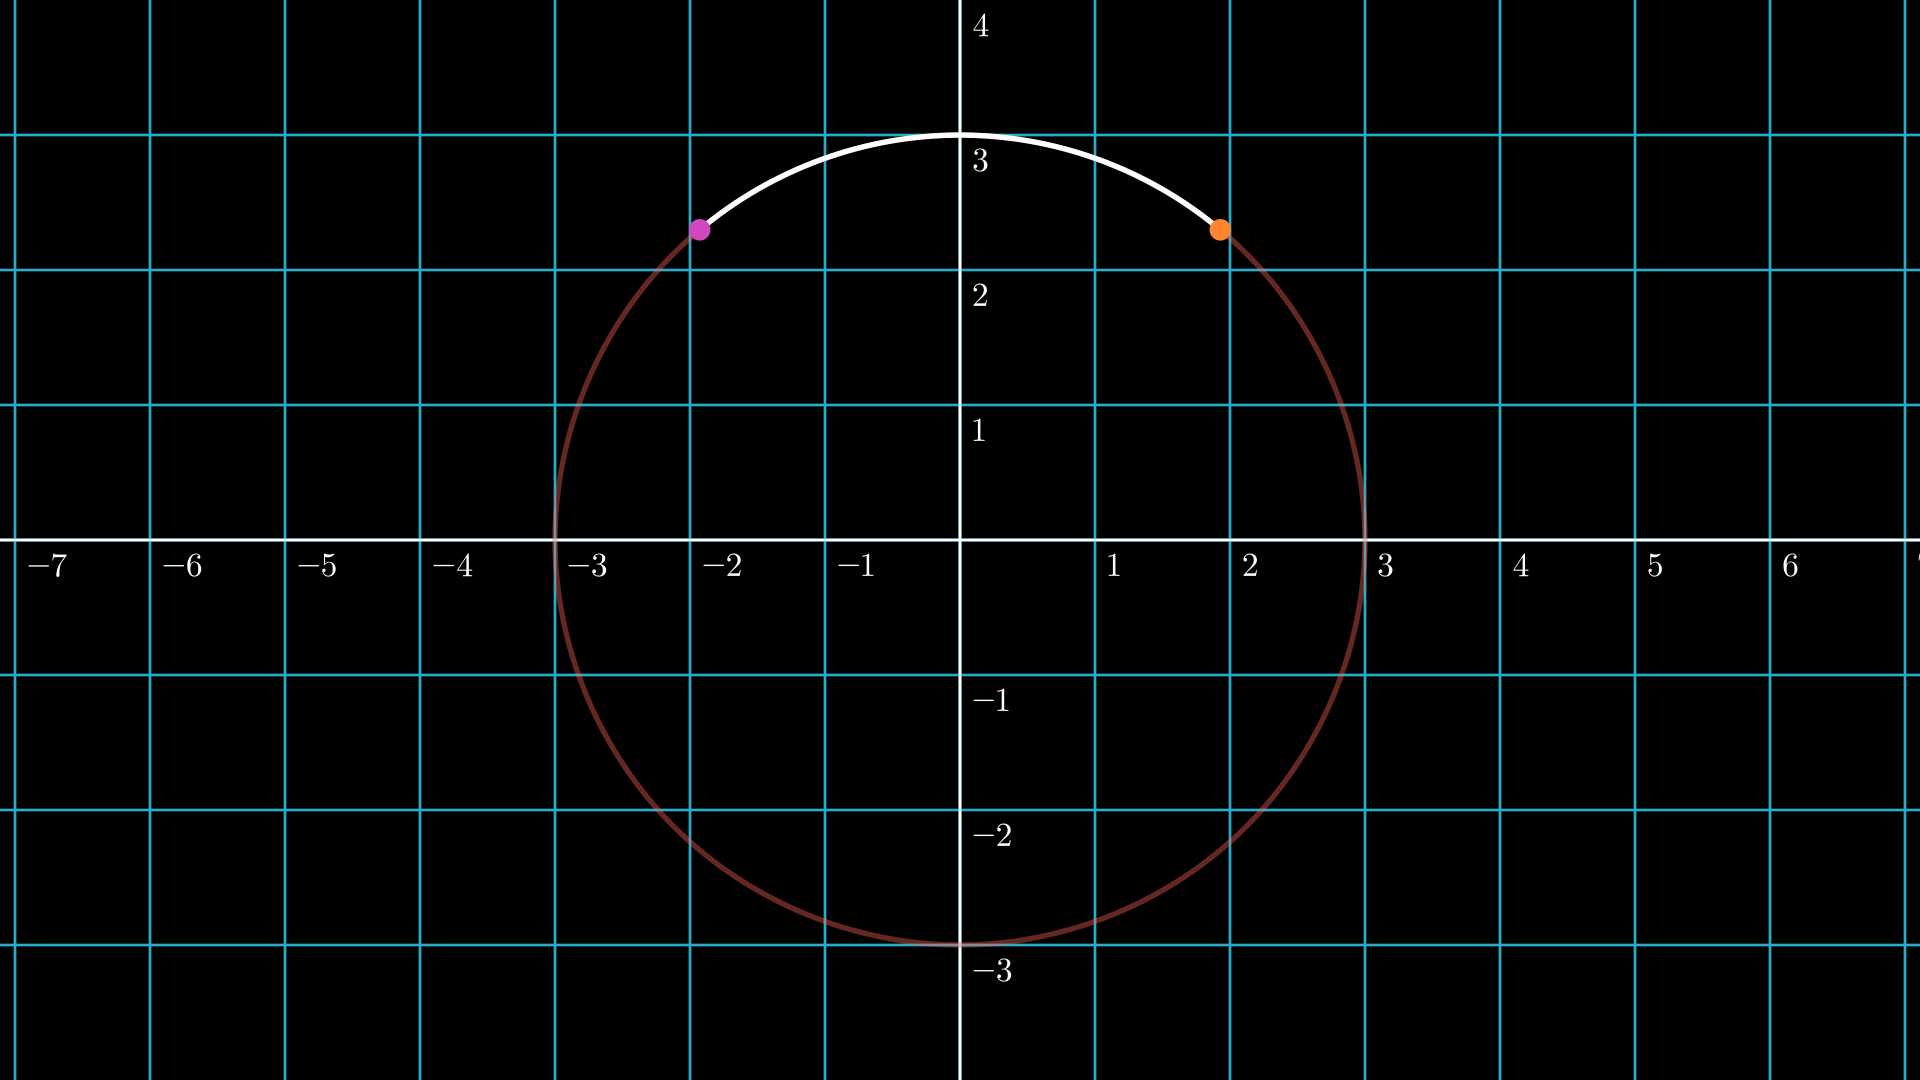
.get_subcurve
Using the concept of point_from_proportion, we can get a part of a VMobject by specifying the starting and ending percentage:
def construct(self):
    def coord(x,y):
        return np.array([x,y,0])

    points = [
        coord(x,y)
        for x,y in [
            (-6,3),
            (-1.5,-1),
            (0,0),
            (2,-3),
            (3.5,2)
        ]
    ]

    path = VMobject(color=BLUE).set_points_smoothly(points)
    partial_path = path.get_subcurve(0.1,0.9)
    partial_path.set_style(stroke_width=10,stroke_color=RED)

    self.add(path,partial_path)
Show result
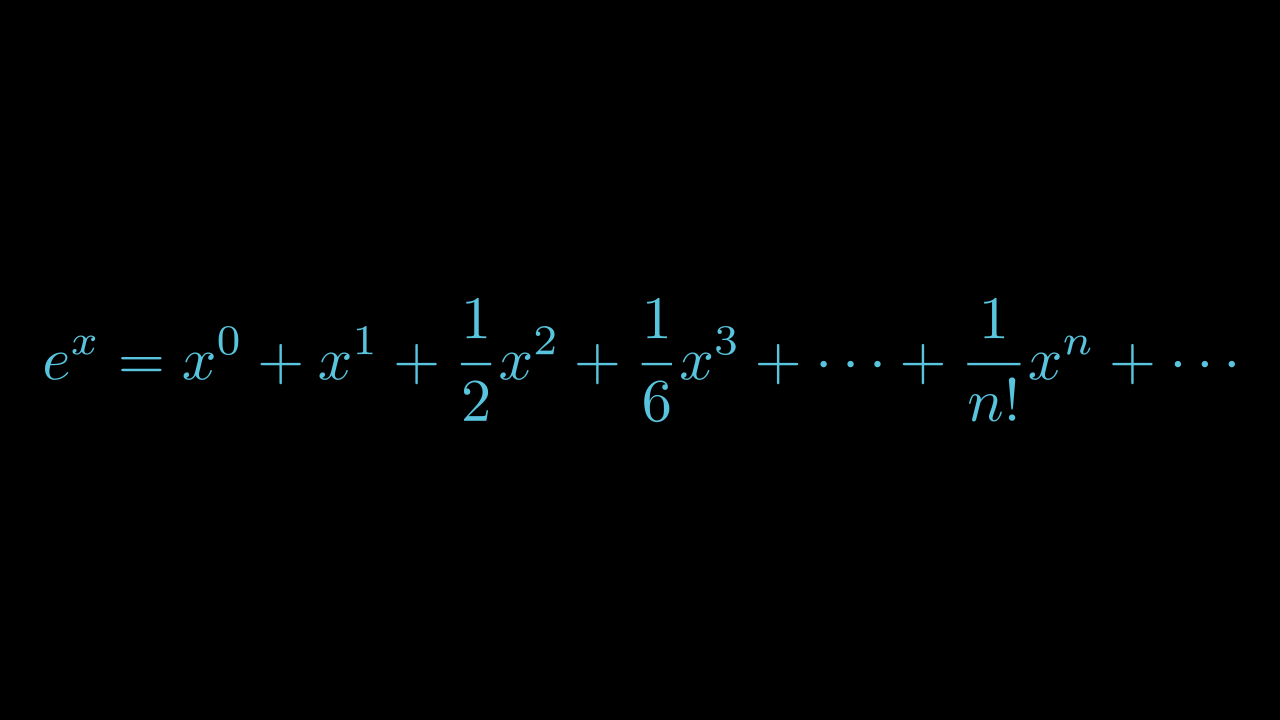
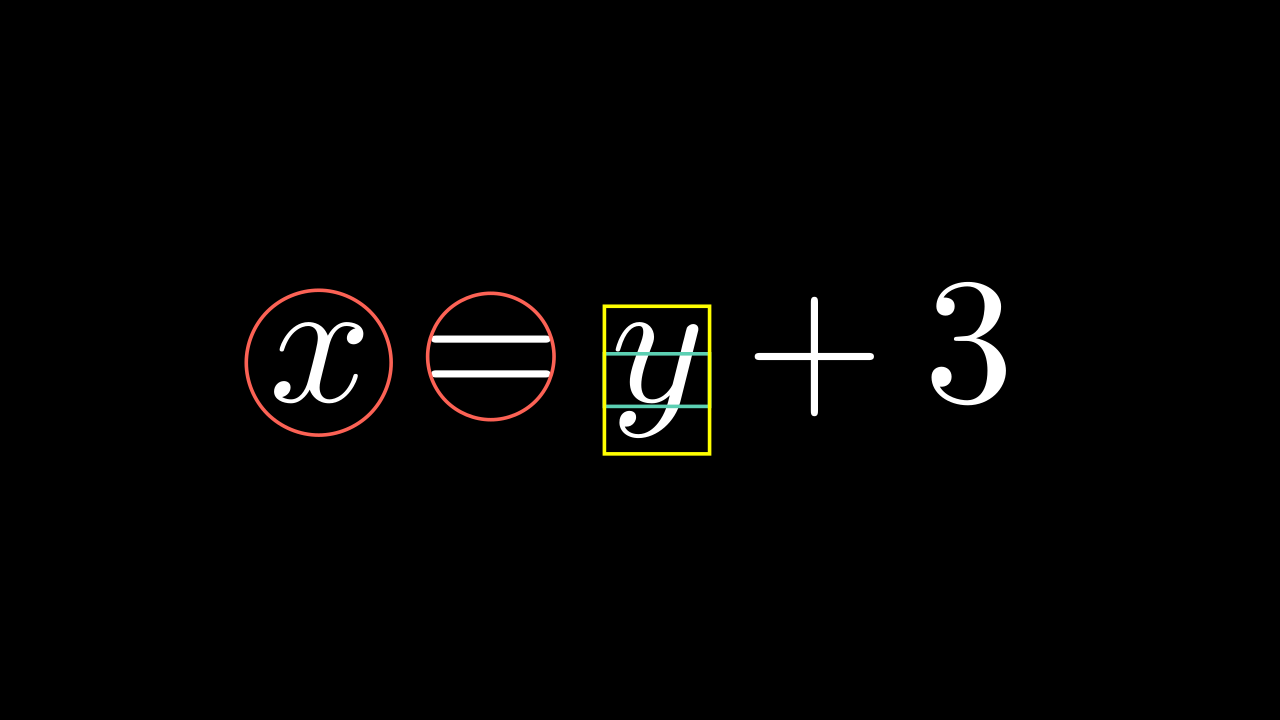
.set_color_by_tex
In the Tex section we saw that there is an argument that allows us to color certain text, but sometimes we need to color certain parts afterwards, for this we use this method. However, to achieve this effectively we have to isolate the text as we saw it in TransformMatchingTex.
def construct(self):
    equation = MathTex(
        r"e^x = x^0 + x^1 + \frac{1}{2} x^2 + \frac{1}{6} x^3 + \cdots + \frac{1}{n!} x^n + \cdots",
    )
    # FAIL
    equation.set_color_by_tex("+", YELLOW)
    equation.set_color_by_tex("x", BLUE)
    equation.width = config.frame_width - 1
    self.add(equation)
Show result
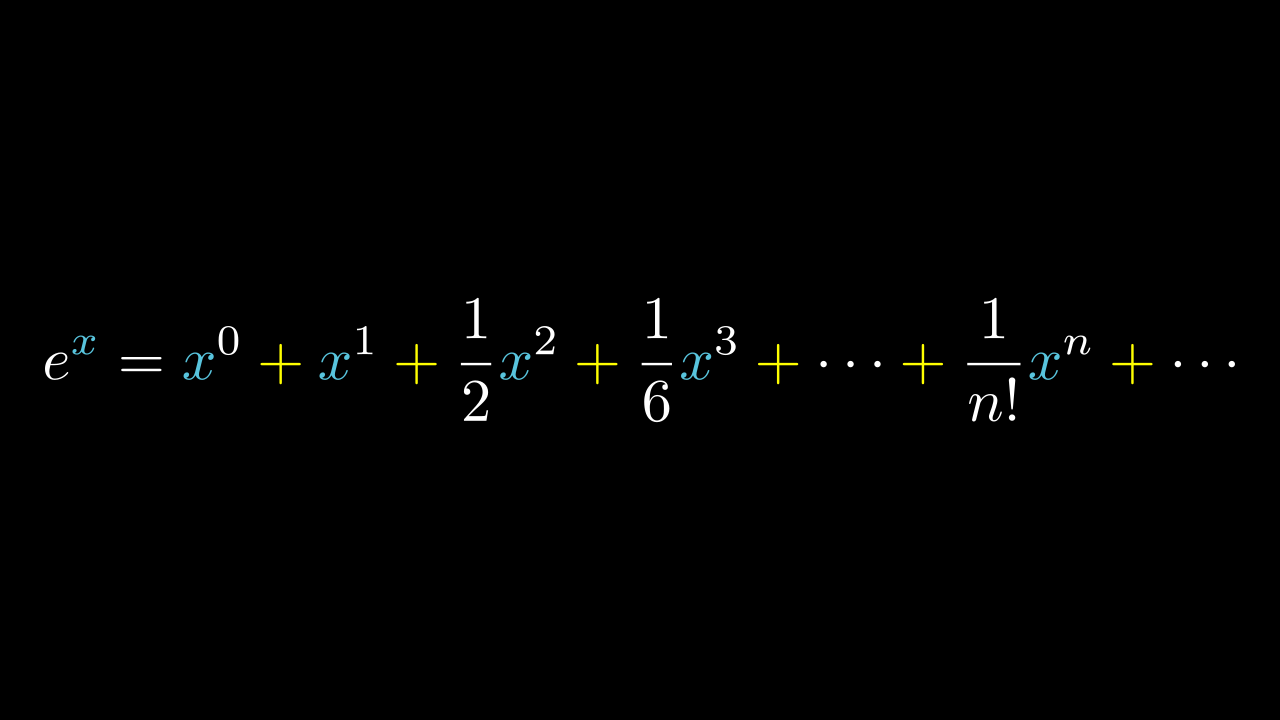
Succesull coloring:
def construct(self):
    equation = MathTex(
        r"e^x = x^0 + x^1 + \frac{1}{2} x^2 + \frac{1}{6} x^3 + \cdots + \frac{1}{n!} x^n + \cdots",
        substrings_to_isolate=["x","+"]
    )
    equation.set_color_by_tex("+", YELLOW)
    equation.set_color_by_tex("x", BLUE)
    equation.width = config.frame_width - 1
    self.add(equation)
Show result
We could have done this using tex_to_color_map in MathTex instance, but sometimes you will want to color certain parts in different parts of the code, and in this way it can be achieved. But remember that if your formulas are too complex then they will not work.
.save_state and Restore
This is a very simple method, basically it is about creating a temporary copy in a time state of a Mobject, and after applying certain modifications to it, using Restore we can return to the point where we saved the state.
def construct(self):
    FRAME_WIDTH = config.frame_width
    text = Tex("Original")\
           .set(width=FRAME_WIDTH/2)

    text.save_state()

    text_2 = Tex("Modified")\
           .set(width=FRAME_WIDTH/1.5)\
           .set_color(ORANGE)\
           .to_corner(DL)

    self.add(text)

    self.play(Transform(text,text_2))
    self.play(
        text.animate.shift(RIGHT).rotate(PI/4)
        )
    self.play(Restore(text))

    self.wait(0.7)